
1. The bottleneck is not the sensors
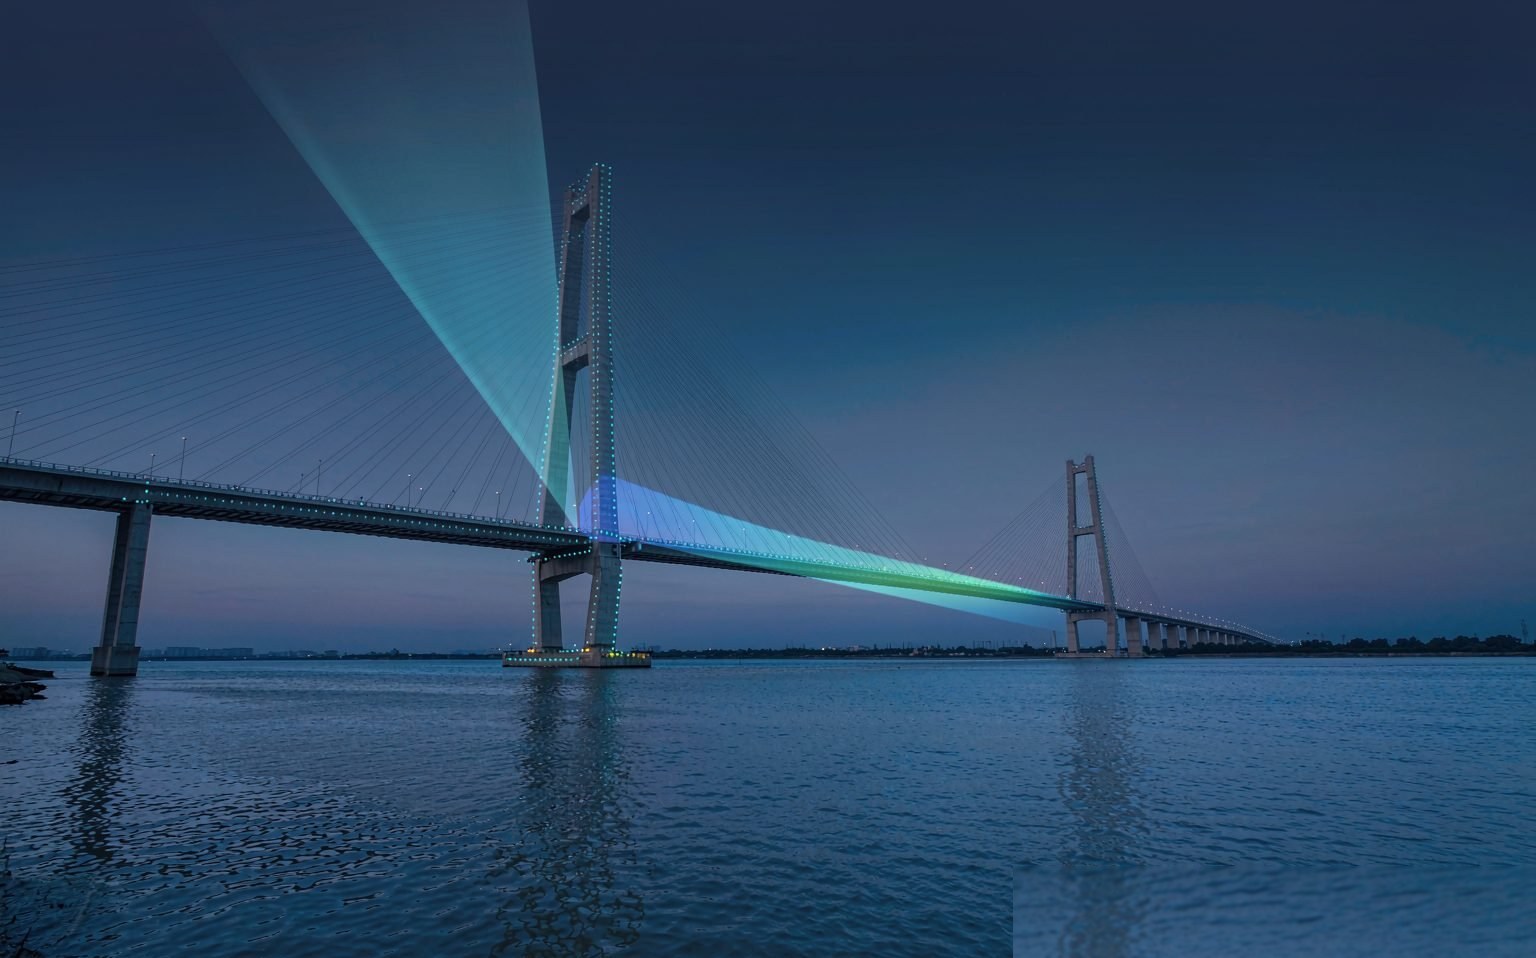
The scarcest resources for bridge owners have never been sensors — they are people and time. China now has more than 1.1 million highway bridges, including nearly 10,000 extra-large bridges, plus close to 30,000 highway tunnels. Under current maintenance codes, extra-large bridges require periodic inspection and ordinary bridges routine patrols. Spread the inspection workforce across that inventory and the time available per bridge each year is measured in hours.
The problem is that settlement and tilt are slow variables. A pier moving 3 mm a year shows nothing unusual to the eye; by the time bearings are misaligned, girder ends are jammed or expansion joints are crushed, cumulative displacement is typically already in the centimetre range. Detecting these "slow failures" through manual inspection is essentially a gamble.
Satellites offer another route. Since Sentinel-1 opened its data in 2014, time-series InSAR has gradually moved from a research tool to an engineering practice: no instruments on the bridge, no road closures or climbing required. A single pass can sweep every bridge within a prefecture-level city, together with the surrounding slopes, and return millimetre-level annual deformation rates. It does not solve everything, but it turns "which bridges should we inspect first" from a matter of experience into a ranked list.
2. How millimetres are actually measured
InSAR does not measure distance — it measures phase.
A radar transmits an electromagnetic wave, which reflects off the target and returns; the round-trip phase encodes geometric range. Subtract the topographic phase, orbit error and atmospheric delay from the phase difference between two acquisitions of the same location and what remains is displacement along the line of sight (LOS).
Sentinel-1 operates in C-band with a wavelength of 5.6 cm. A full 2π phase cycle corresponds to half a wavelength, i.e. 2.8 cm of displacement; modern interferometric processing measures phase to one-twentieth of 2π or better, which works out to the millimetre level. That is the physical origin of InSAR's millimetre sensitivity — it is not algorithmic extrapolation.
In practice there are three main routes:
- D-InSAR: a single interferogram from two acquisitions, good at capturing sudden events (earthquakes, landslides, subsidence), centimetre-level accuracy, strongly affected by the atmosphere — mostly used for emergencies.
- PS-InSAR: selects persistently coherent "permanent scatterers" — building corners, rock outcrops, guardrail bolts — and solves them jointly over a stack of 20 or more images to obtain annual rates, reaching 1–2 mm/year in favourable areas.
- SBAS-InSAR: targets distributed scatterers, grouping images into baseline subsets, better suited to slopes, banks and bare ground outside urban areas.
Technical change over the past two years has concentrated at both ends: AI-based phase unwrapping and coherence prediction are automating steps that used to rely on manual tuning, while denser constellations are cutting revisit times from 12 days to a few days, making "monthly updates" realistic.
3. Bridges are among the hardest targets for InSAR
Apply InSAR directly to a bridge and you will hit four pitfalls in a row — any one of them is enough to invalidate the result.
Pitfall 1: the north–south direction is nearly blind. Current SAR satellites mostly fly in near-polar orbits, so the line of sight is dominated by east–west and vertical components; sensitivity to north–south displacement is an order of magnitude smaller. On a north–south bridge, longitudinal displacement is essentially invisible. Checking the bridge's orientation should therefore be the first step of any analysis — and it is the step most often skipped.
Pitfall 2: thermal expansion is an order of magnitude larger than settlement. The linear expansion coefficient of steel is about 1.2×10⁻⁵/°C. For a 200 m steel box girder with a 30 °C seasonal temperature range, the movement is 200,000 × 1.2×10⁻⁵ × 30 ≈ 72 mm, while the annual settlement signal we are looking for is typically only 2–5 mm. Without separating temperature, what you see is a curve that follows the air temperature — easily misread as a "periodic anomaly". The standard practice is to regress the deformation time series against measured or reanalysis temperature and take the trend of the residual.
Pitfall 3: geometric distortion. Bridges in mountain gorges easily fall into layover, foreshortening and radar shadow zones, where the imaging geometry itself is unreliable; bridges crossing rivers or valleys also sit right next to water surfaces.
Pitfall 4: coherence. Water looks completely different between two acquisitions, so the main span over a river struggles to stay coherent. The points that persist are usually towers, piers, anchorages and the slopes on both banks. Smooth metal decks scatter weakly in the diffuse sense, so PS points are sparse — one point every few tens of metres is normal. To raise point density, projects install corner reflectors on critical sections; a few thousand yuan each buys a high-quality observation point with known coordinates that stays stable year after year.
4. Data sources: free versus premium
| Source | Band | Resolution | Revisit | Best for |
|---|---|---|---|---|
| Sentinel-1 | C (5.6 cm) | 5 m × 20 m | 12 days single, 6 days twin | Regional screening, free and open |
| LuTan-1 (L-SAR) | L (23.6 cm) | ~3 m | Twin formation, within a week | Vegetated areas, domestic-data requirements |
| Gaofen-3 | C | ~1 m | A few days | Detailed survey of key targets |
| Commercial constellations | X/C | Sub-metre | Tasked on demand | Dense observation of a single bridge |
The selection logic is simple: free data for screening, paid data for detailed survey. C-band scatters favourably from buildings and bridges and is the workhorse for screening; L-band has a longer wavelength and better vegetation penetration, an advantage in mountainous and forested terrain, but ionospheric delay is more pronounced and needs extra correction. For domestic projects with data-compliance requirements, domestic sources should be preferred — and that decision belongs in the proposal stage.
5. A six-step workflow that actually ships
- Vectorise the asset register: put each bridge's location, orientation and structural type into GIS, generate a 200 m buffer along the bridge axis, and spatially join it with PS points. Orientation determines whether the data is usable at all.
- Build the image stack: same track number, same imaging mode, at least 24 scenes covering three years or more. Below that, the confidence interval of the trend estimate becomes meaningless.
- Phase processing: joint PS and distributed-scatterer point selection, phase unwrapping, atmospheric correction. For C-band use ERA5 or GACOS products; L-band also requires ionospheric correction.
- Signal separation: temperature regression and trend estimation, outputting annual rate, cumulative deformation and the timing of abrupt changes.
- Risk grading: use both rate and cumulative value. For example, below 2 mm/year is stable, 2–5 mm/year goes on a watch list, and above 5 mm/year or a single-epoch jump triggers re-verification.
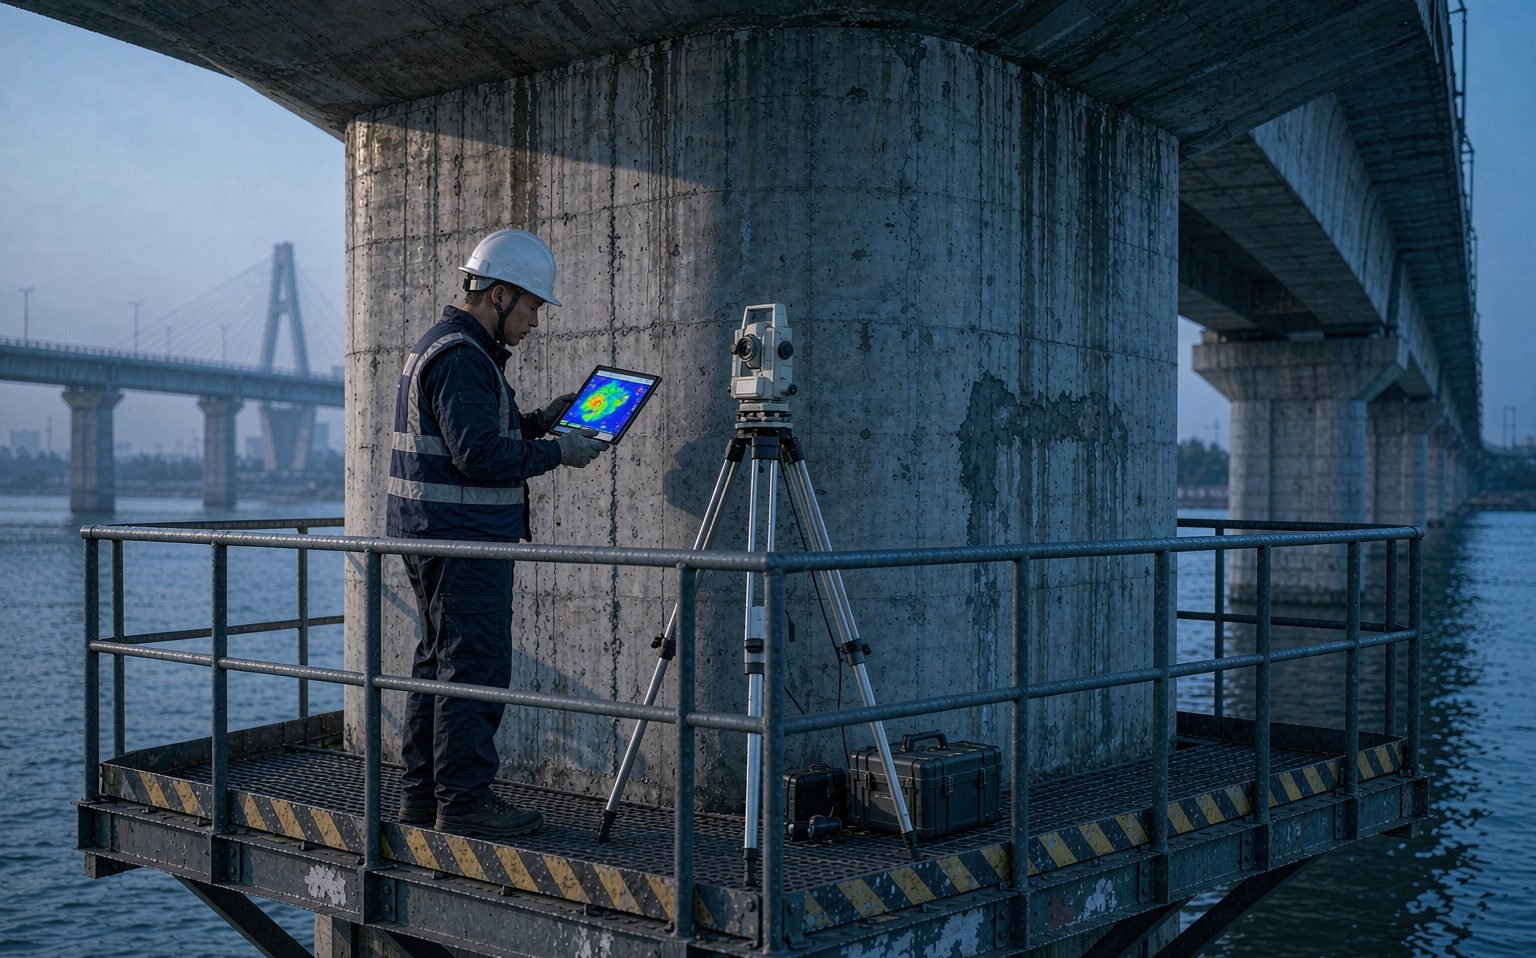
- Close the loop in the field: verify suspect points with a total station, levelling or GNSS, turning satellite "suspicions" into "confirmed" or "ruled out".
Step six is the most underrated. Without field verification, an InSAR result is just a pretty coloured map; with it, the result becomes a chain of evidence usable for maintenance decisions.
6. Cost and boundaries
Sentinel-1 data is free; a three-year image stack for a prefecture-level city is a few hundred GB, and the main costs are computing and labour. Commercial sub-metre imagery is quoted in the tens of thousands of yuan per scene and suits dense observation of individual bridges. By comparison, a single routine inspection of an extra-large bridge with a kilometre-scale main span typically costs hundreds of thousands of yuan. Satellite screening therefore does not replace manual inspection — it gives the question "which bridges deserve priority" an evidential basis, directing limited resources where they matter most.
The boundaries must be stated just as clearly:
- InSAR measures line-of-sight displacement, not 3D displacement. A single track cannot separate horizontal from vertical components; ascending/descending combinations or GNSS constraints are needed.
- It cannot see cracks, exposed reinforcement or voided bearings, and it does not replace load testing or load-carrying capacity assessment.
- "No anomaly at a point" is not "no problem in the structure" — gaps between sparse points still have to be covered by ground-based methods.
There are well-documented reference cases in the open literature. A 2019 study used Sentinel-1 and COSMO-SkyMed data to reconstruct the deformation sequence of Italy's Morandi Bridge before its collapse, finding long-term displacement trends at some piers that were uncorrelated with temperature. Such retrospective analyses demonstrate the method's sensitivity, and also remind us that while satellites can measure a trend, turning that trend into a risk judgement still requires a structural engineer.
7. How spaceborne, ground and in-structure data should divide the work
Placed within a complete monitoring system, the satellite's role is clear: satellites cover the "area", responsible for periodic screening and trend discovery; GNSS covers "points", responsible for continuous 3D displacement at critical piers and abutments; fibre Bragg grating sensors cover "sections", responsible for high-frequency responses such as strain, cable force and temperature. Only when all three layers share the same spatial and temporal reference can structural condition assessment begin.
The practical difficulty is that their time scales differ by two orders of magnitude: satellites deliver results weekly or monthly, while fibre samples in milliseconds. Satellite planimetric accuracy is at the metre level, whereas sensor installation coordinates must be accurate to the centimetre. The hard part of fusion is rarely the algorithm — it is the unification of references: bridge coordinate systems, vertical datums and time synchronisation. These unglamorous basics determine whether the analysis above them can stand.
8. Conclusion
Time-series InSAR is not a new concept, but it is moving from journal papers into maintenance ledgers. The real barrier is not whether you can operate the software, but three things: knowing when it fails (orientation, temperature, coherence, geometric distortion), knowing what should be used to validate its output (field verification, GNSS, levelling), and knowing where it belongs in the overall system — screening, not verdict.
For bridge owners, the most tangible change may be this: inspection priorities used to be decided by experience and luck, and now there is a list ranked in millimetres. That list will not make anything safe by itself, but it gives limited inspection capacity, for the first time, a clear order of priority.